Cubes
A cube is a numeric analysis showing a selected subset of the database broken down by one or more dimensions. You can define which variables are used in the analysis and can use the results as a basis for further selection or analysis.
.png "Example Source Data")
.png "Dimensional cube of Occupation against Title")
Elements of a cube
- The Occupation variable is displayed on the Rows dimension.
- The Title variable is displayed on the Columns dimension.
- Each cell shows the calculated result showing total records with values at intersection of row and column axes.
- Each cell's background is shaded to highlight values. See Selecting Cells and Changing Thematic Shading.
- Row totals are shown in the rightmost column.
- Column totals are shown in the bottom row.
- Grand total is displayed in the bottom right hand cell.
When should I use a cube?
Use a cube when you want to analyse a subset of the database in greater depth. You might, for example, want to see a breakdown of Postal Areas by Gender for a particular selection or on the whole database. Clearly a cube gives you more information than a single count.
A cube can calculate and display many numeric functions as part of the analysis.
How does a cube organise the data?
A cube is displayed as a two dimensional grid of cells. In the simple case, each cell shows the number of records which fall into the intersecting categories of the dimension variables.
A cube can represent multiple dimensions by nesting. The following example shows a 3 dimensional cube of Title, Source and Occupation.
The nesting arrangement can be changed by rotating the cube.
The example below shows 4 nested cells each highlighted with a red boundary box.
.png)
The cells are thematically shaded. In the example above, the darker the shade, the higher the cell count.
Note
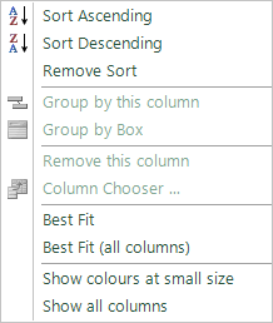
Right click on a column header to access different options for displaying your data.
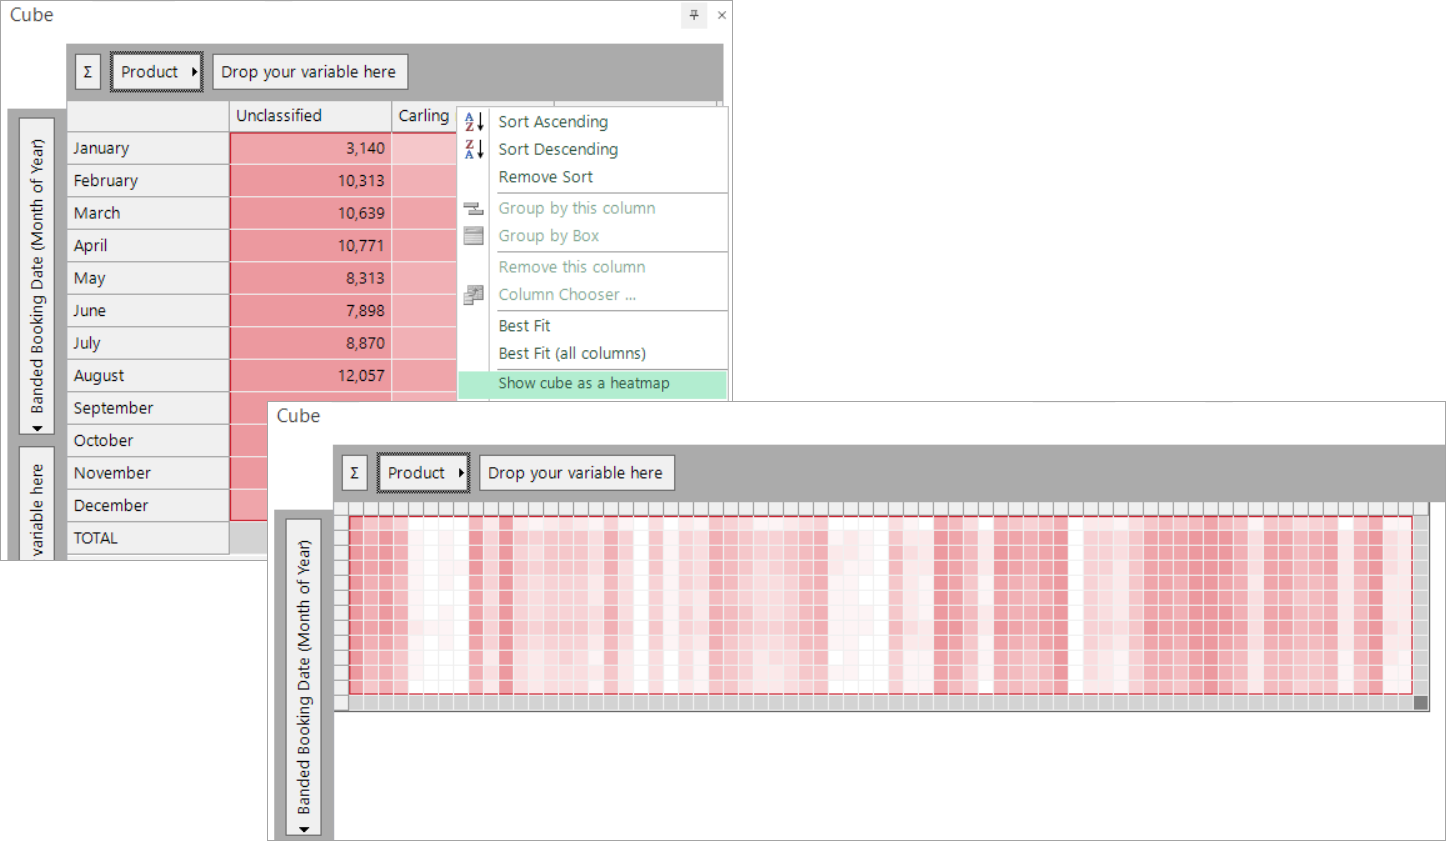
Show cube as a heatmap
You can shrink the cells in a cube and display the thematic shading in a heat-map view, providing you with a very quick and accessible way, for example, to carry out data quality checks or, when working with banded date variables, to examine seasonality of products.
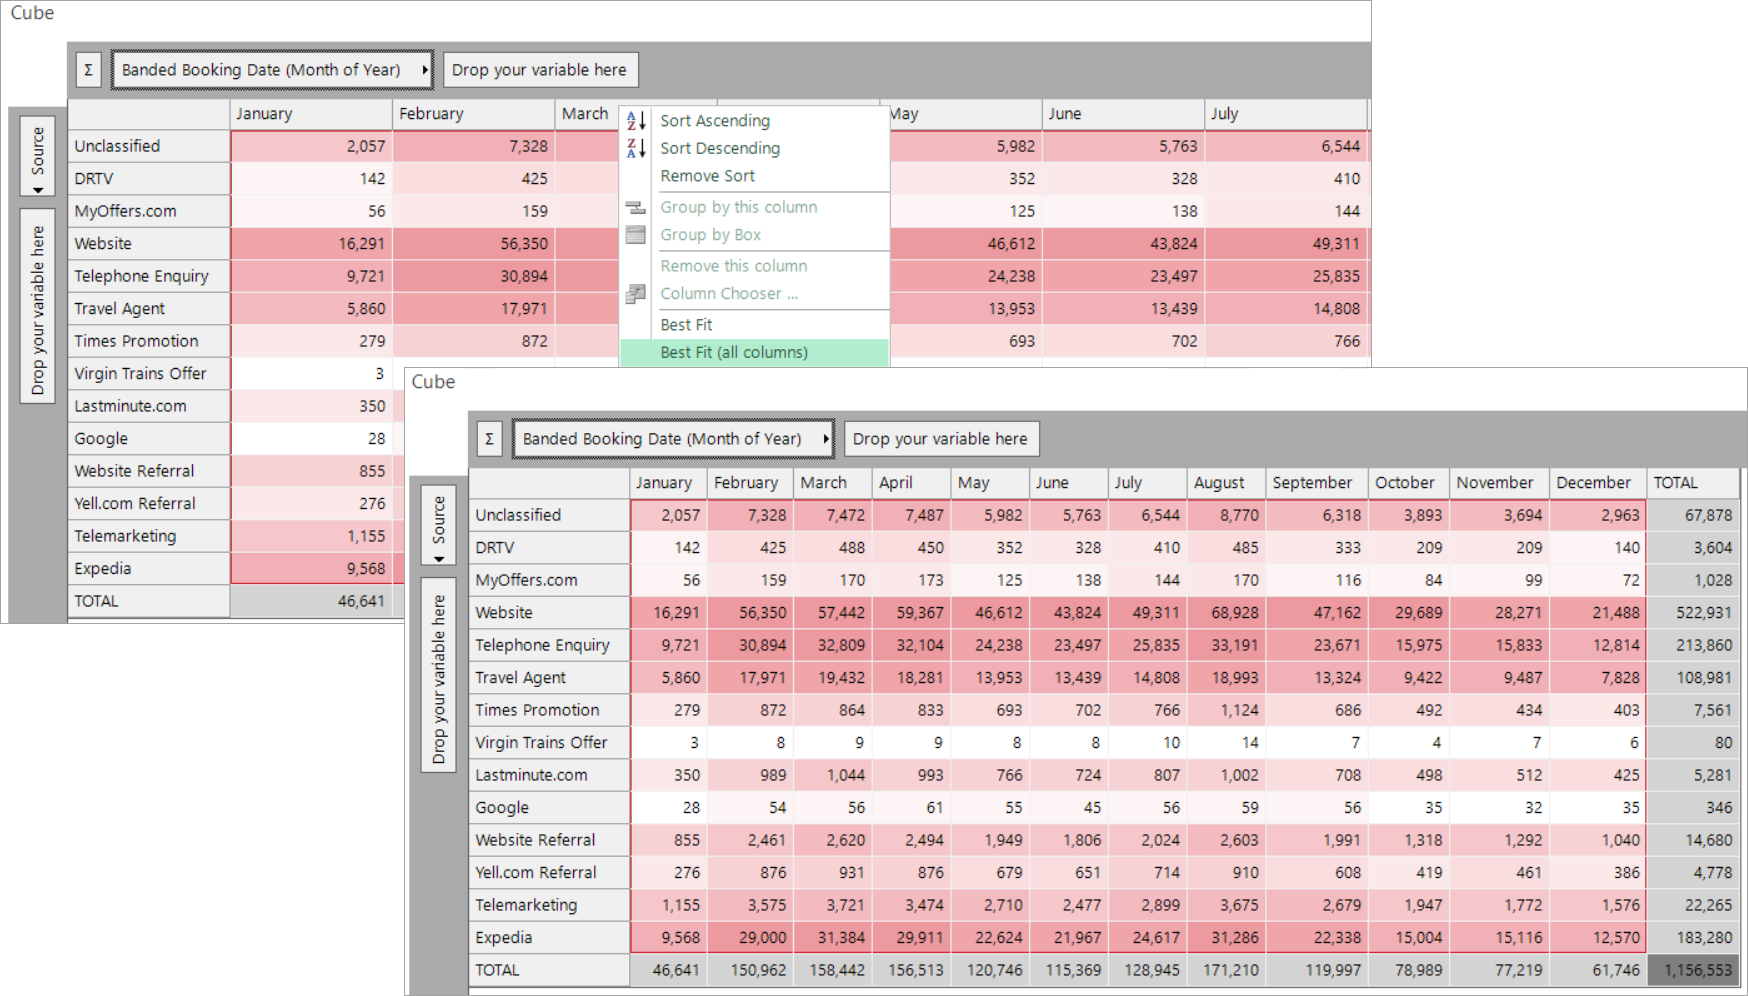
Best fit (all columns)
For ease and convenience, you can select to apply Best fit (all columns) to the cells displayed in a cube, rather than needing to set each column individually.