Creating a dashboard
Create a new dashboard to start visualising and analysing your data.
Create a new dashboard
To create a new dashboard:
- In Orbit, go to the Dashboards screen.
-
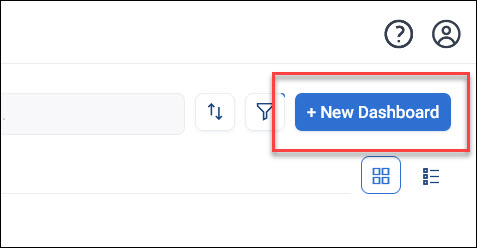
Click + New Dashboard.
-
Enter a meaningful name for your dashboard.
- Click Create.
A blank dashboard opens in edit mode.
Tip
You can also create a dashboard from the Orbit homepage: click Create Dashboard, enter a name, and click Create.
Add your first tile
Note
If you aren't in Edit mode, click Edit in the top right corner of the dashboard.
To add a tile to your dashboard:
- Click + New Tile.
- Give the tile a meaningful name, then click Create.
-
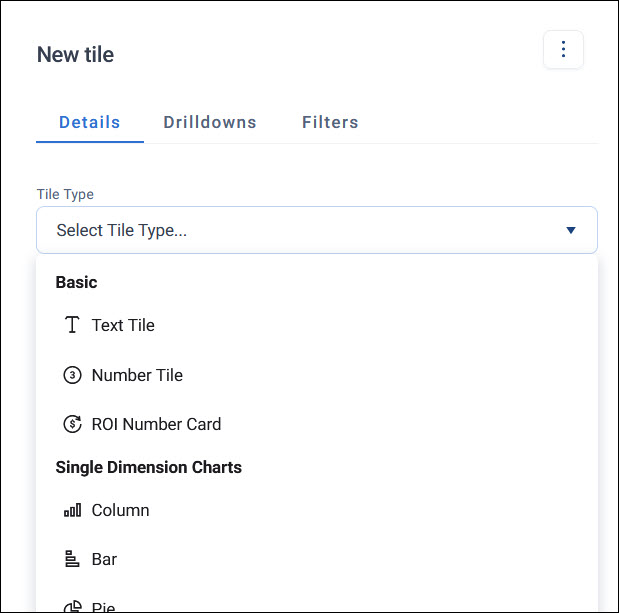
Choose a tile type, such as a chart, data grid, or number tile.
-
Configure the tile using your data.
See Tiles for the full range of tile types and how to configure them.
-
Click Apply.
Example
A stewardship officer creates a "Donor Retention" dashboard. They add a number tile showing this month's lapsed donor count, as an early warning to prioritise reactivation calls.
Arrange your tiles
In edit mode, click and drag a tile to move it, or drag its edges or corners to resize it.
You're ready to customise your dashboard's layout, add filters, and analyse your data. See Using dashboards for how to manage and organise your dashboards once you've created them.