Look-alike analytics
Look-alikes use predictive modelling to find prospects that 'look like' your existing best customers. Once created, you can further analyse these audiences using look-alike analytics. You apply this analysis using the model score as a dimension on a cube, or as a column on a data grid. These extra analytics provide deeper insights into your target audience, allowing data-driven decisions on audience size and composition.
To use look-alike analytics, you must first follow the same steps that you would to create a look-alikes audience:
Then, you can analyse your look-alikes.
For more detail on creating look-alikes, see Creating audience look-alikes.
Create an audience
To create an audience:
- Go to the Audience tab in Orbit.
- Select + New Audience.
- Add an Audience Name.
- Select Create.
-
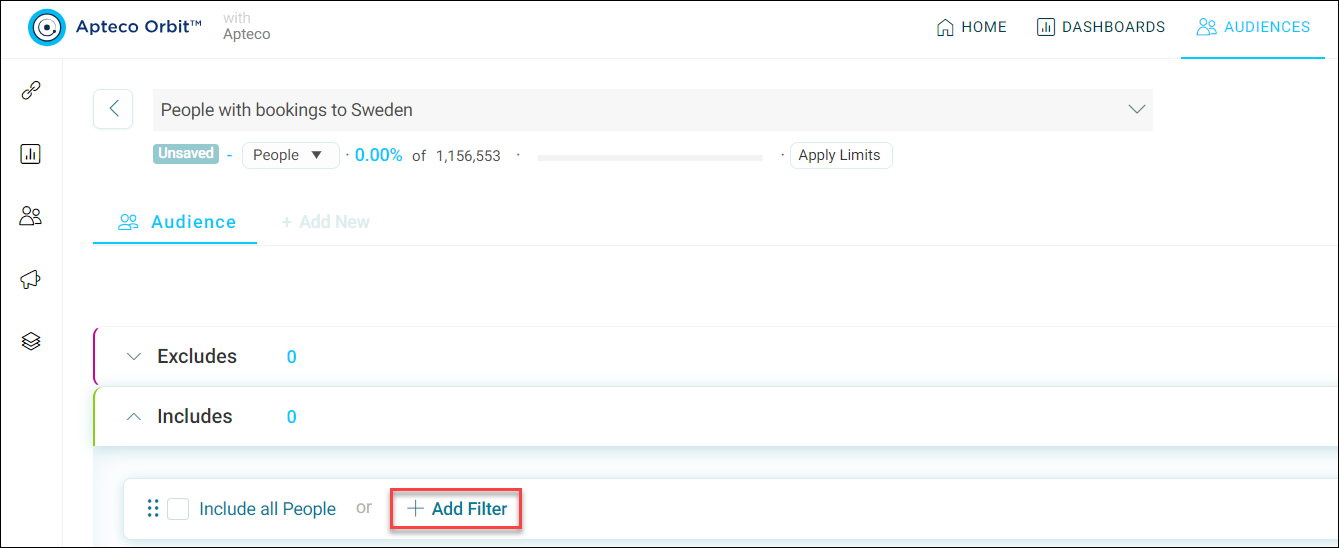
Select + Add Filter.
-
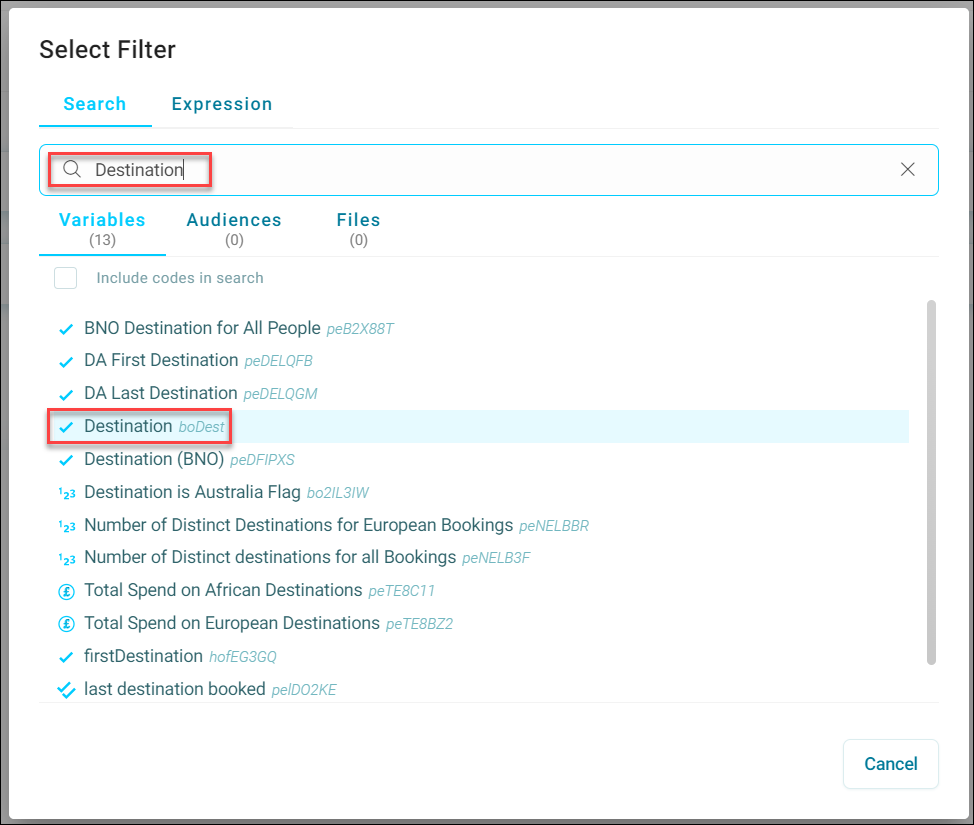
Search for and select the relevant Variable (in this case Destinations).
-
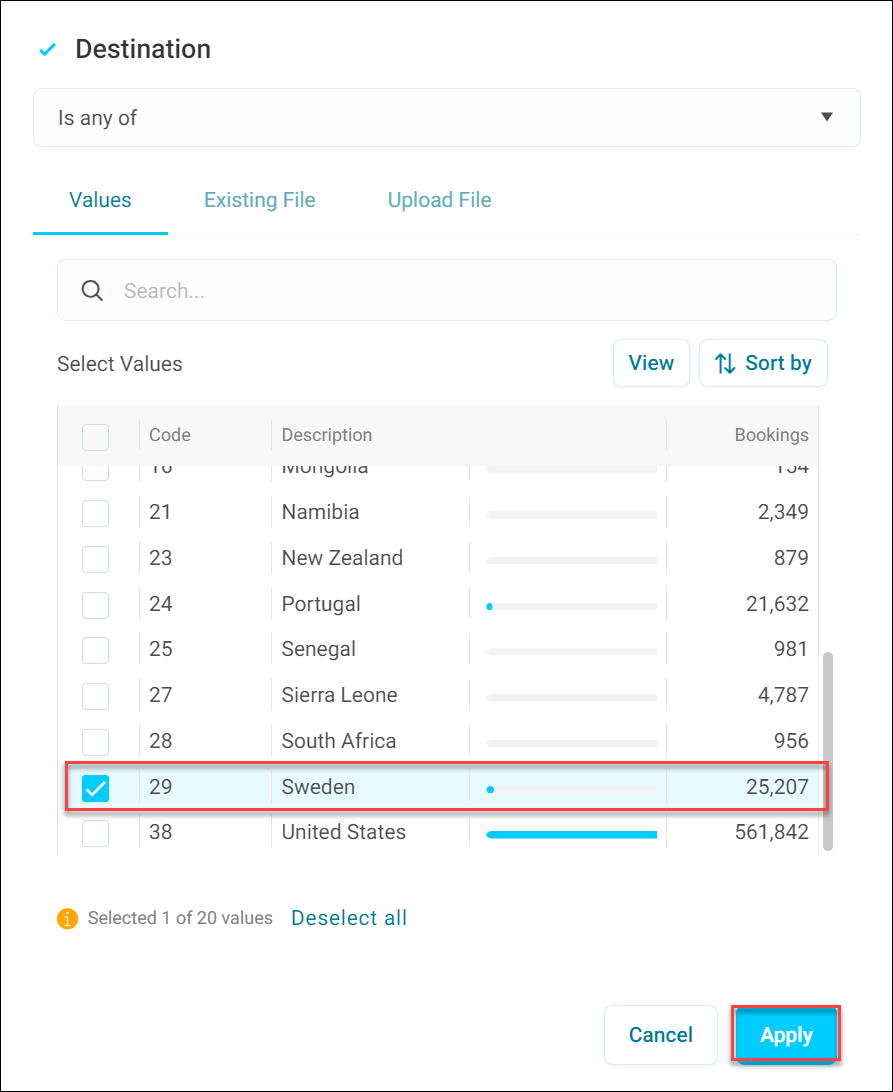
Select the relevant Values (in this case Sweden).
-
Select Apply.
-
Select Save.
Add a look-alikes solution
To create a look-alikes solution:
-
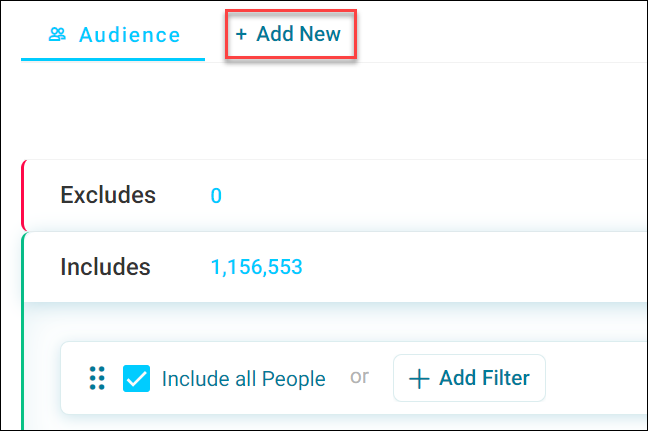
Select + Add New to create a new audience tab.
-
On the Find Look-alikes tile, select Add.
- Add a name to your look-alikes solution and select Next.
-
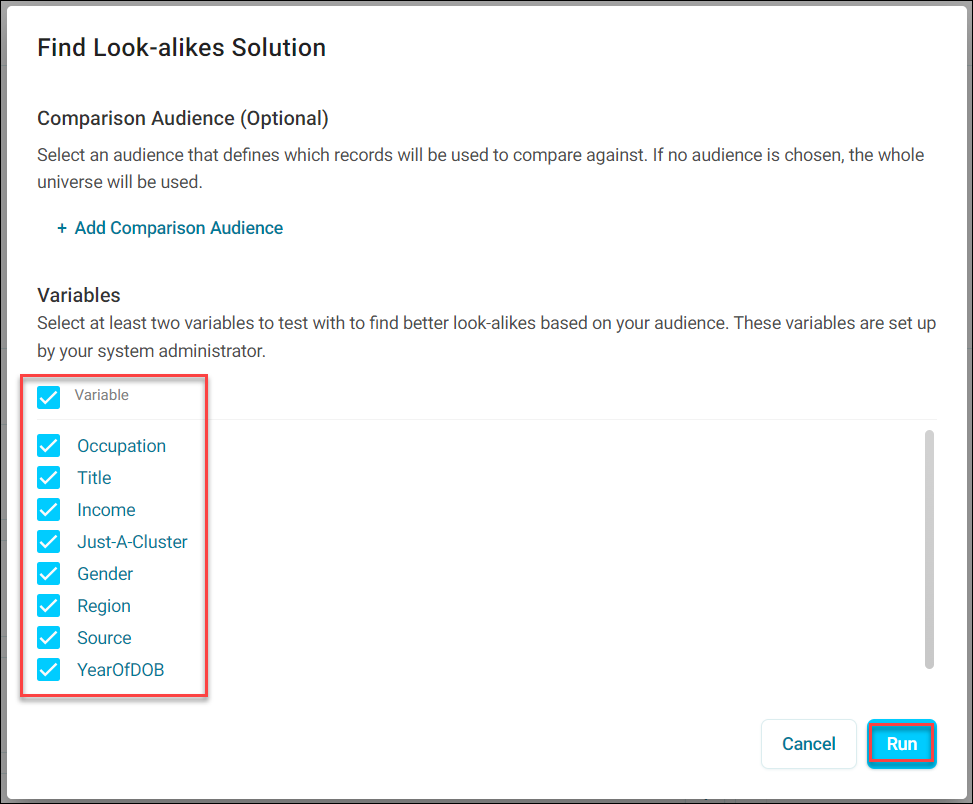
Select the relevant variables and select Run to generate a profile.
Note
Orbit now analyses the characteristics of your audience. You’ll see the results when it’s finished.
-
Once the variables and insights have been generated, select Save.
How variables are ranked
When Orbit generates your look-alikes solution, it ranks the variables using Incremental Insight. This favours variables that are both predictive and diverse, rather than several that tell you the same thing:
- The variables are sorted by Insight PWE, which measures how much predictive insight each one provides. The top variable is ranked first, and its Incremental Insight value equals its Insight PWE.
- Each other variable is then considered, and its Insight PWE is reduced based on its correlation with the already selected variable (using the r-squared value) to give its Incremental Insight value. The variable with the highest value is ranked next.
This repeats for each remaining variable, taking into account all the variables already chosen. A variable that mostly repeats information from higher-ranked variables drops down the list.
When you choose variables for your look-alikes, Orbit automatically selects every variable ranked above your choice, so the model always uses the best variables.
Note
Transactional and flag array variables can’t be ranked using Incremental Insight. They hold multiple values for each record, so correlations with other variables aren’t calculated for them.
For more details, see Incremental insight in the FastStats Modelling Environment help.
You can now start analysing your look-alikes.
Analyse your look-alikes
Once you have gone through the steps above, you can apply complex analytics to your look-alikes audience.
You can analyse your look-alikes by using the model score variable. After using the model score variable, you can analyse further by using the model score in a cube or data grid.
To analyse your look-alikes:
-
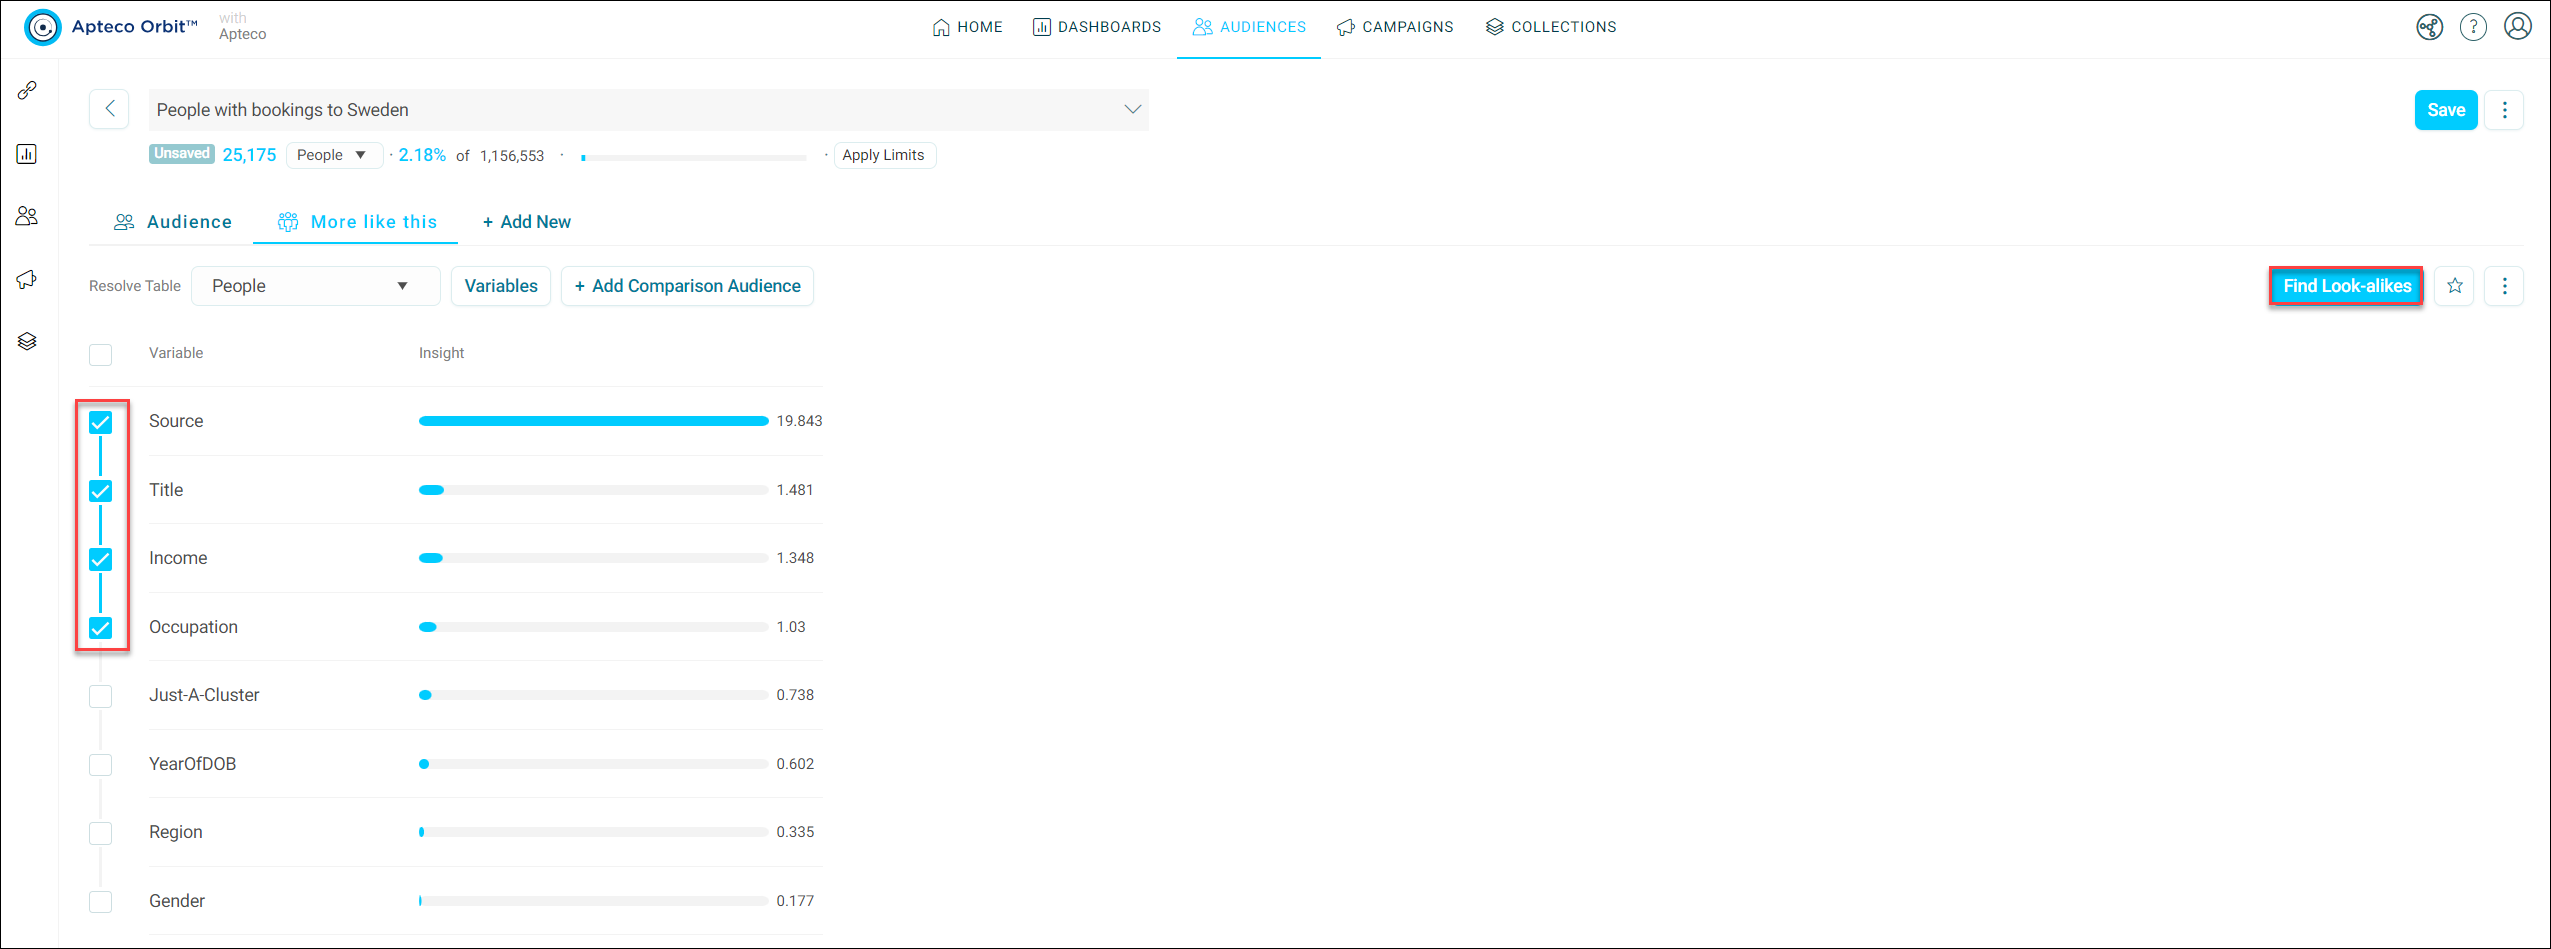
Select the relevant variables and select Find Look-alikes.
-
Within the Analyse Look-alikes tile, select Analyse.
-
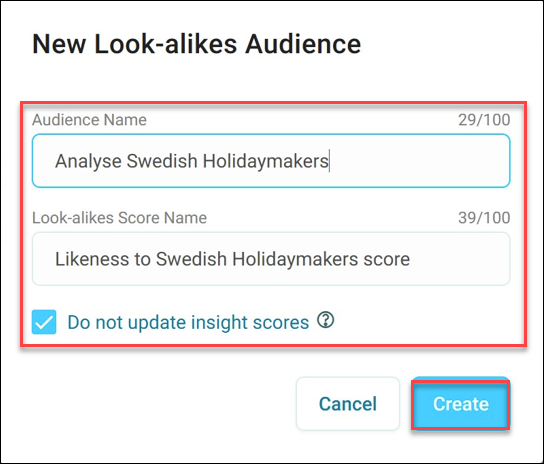
Add an Audience Name, confirm the Look-alike Score Name, and select Create.
Note
Orbit runs a detailed analysis to build your look-alikes audience. You’ll receive a notification when it’s complete. Select the notification to view your analysis.
-
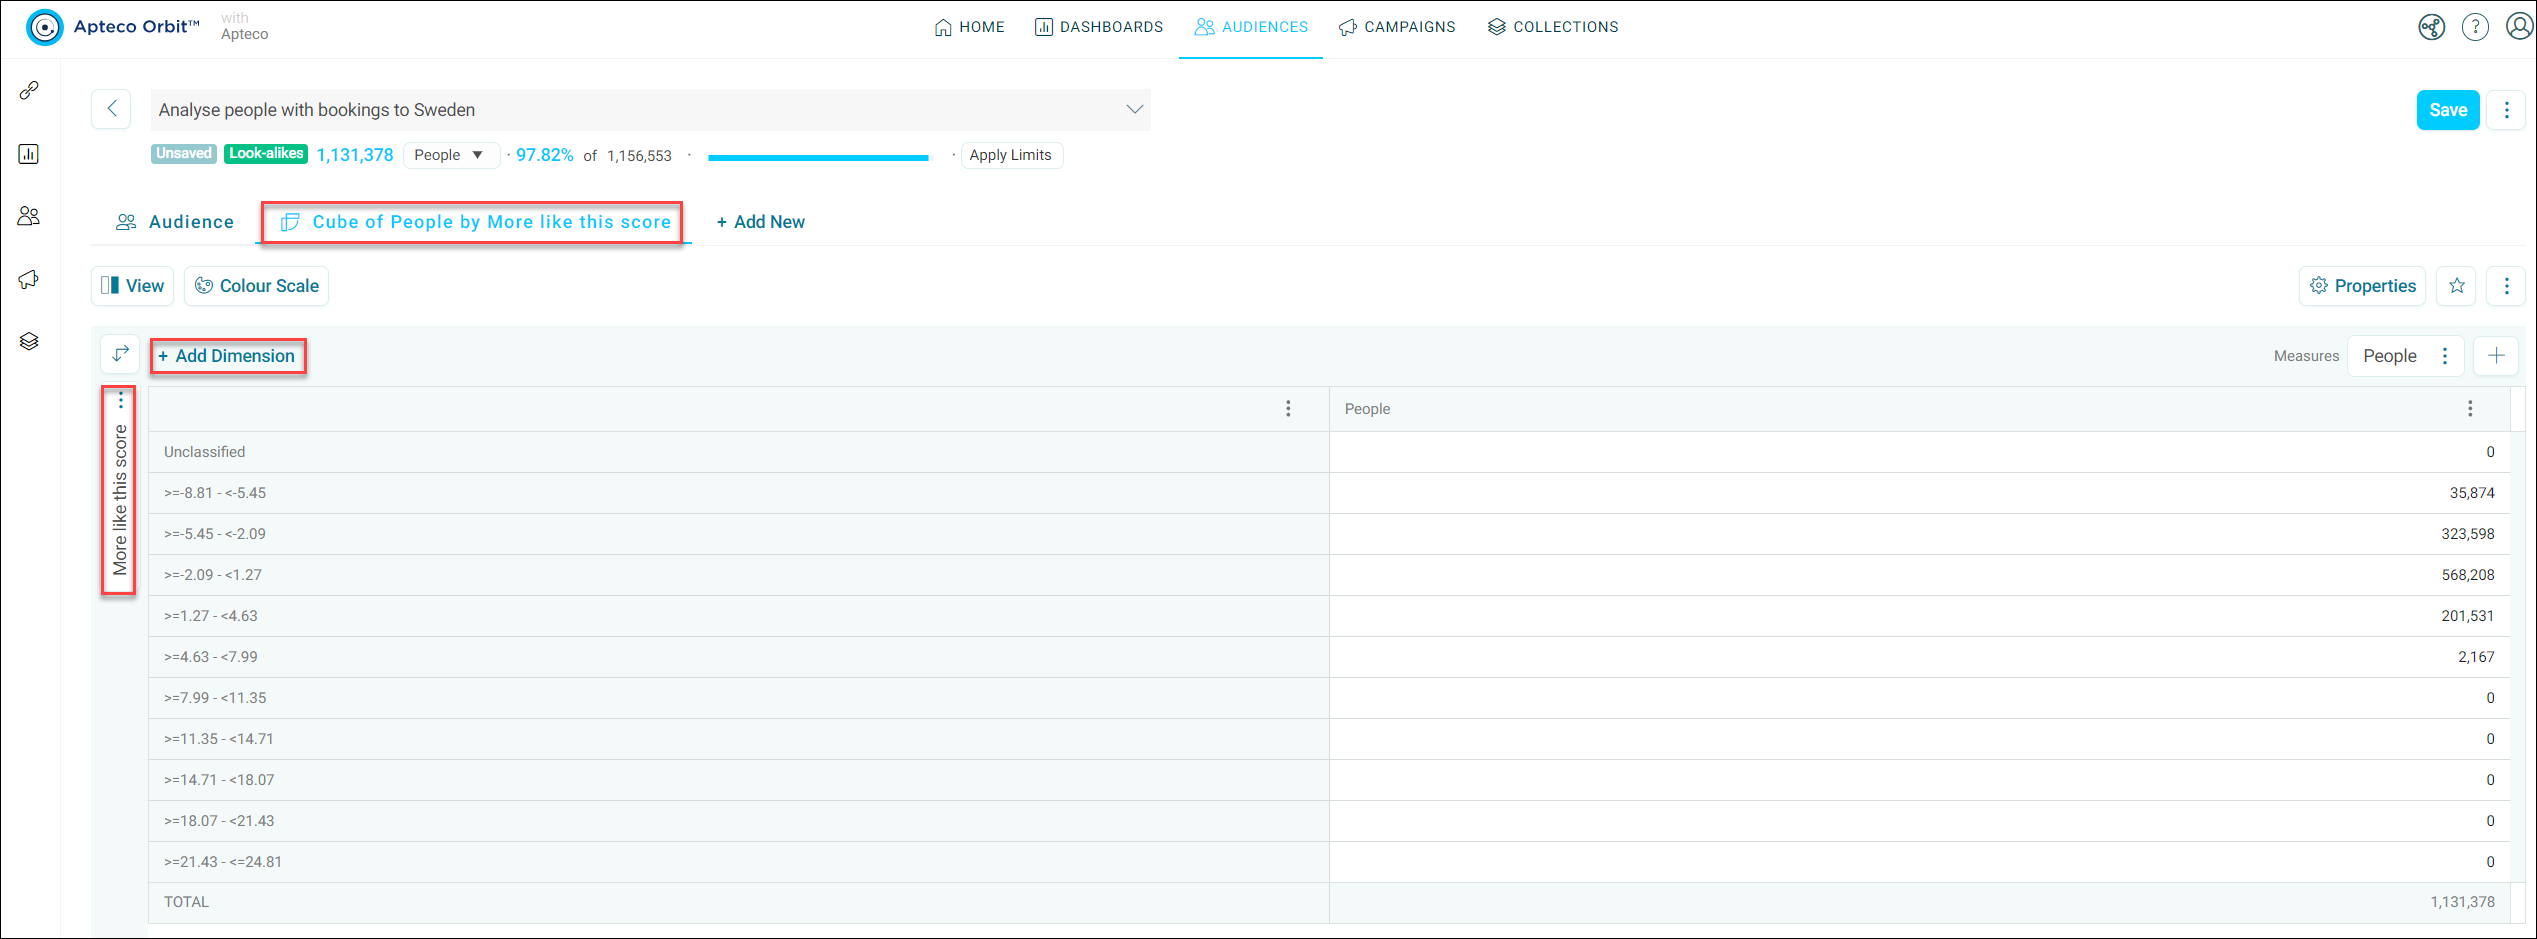
Once complete, you’re presented with a cube showing the banded score as a dimension. Adding another dimension provides further insight.
Note
You can’t make a favourite from this look-alike analysis, as the dimension applied is particular to this audience.
At this point, you can also view each record’s score on a data grid.
To apply your score to a data grid:
-
Select + Add New.
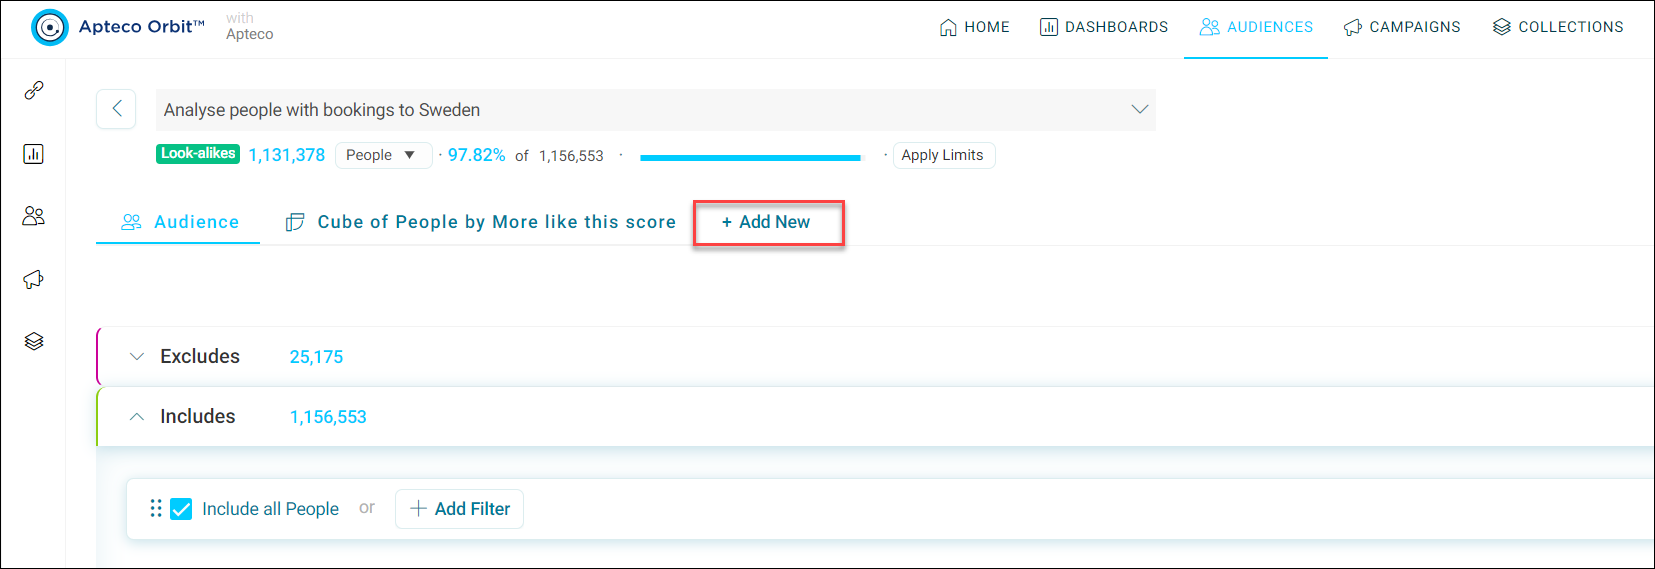
-
On the Browse Data tile, select Add.
- Name your data grid and select Add.
-
Select Edit Columns and add the relevant columns to your data grid, as required.
This provides you with a ‘More like this score’, which allows you to compare the relative similarity of your audience and look-alikes. The higher the score the more similar your look-alikes are to your initial target audience.