Reporting in FastStats
The reports in PeopleStage are intended to give easy access to some of the more commonly required results. It is also possible to use FastStats to access and analyse the history in more detail, and in a more flexible way (e.g. a Venn diagram across multiple campaigns).
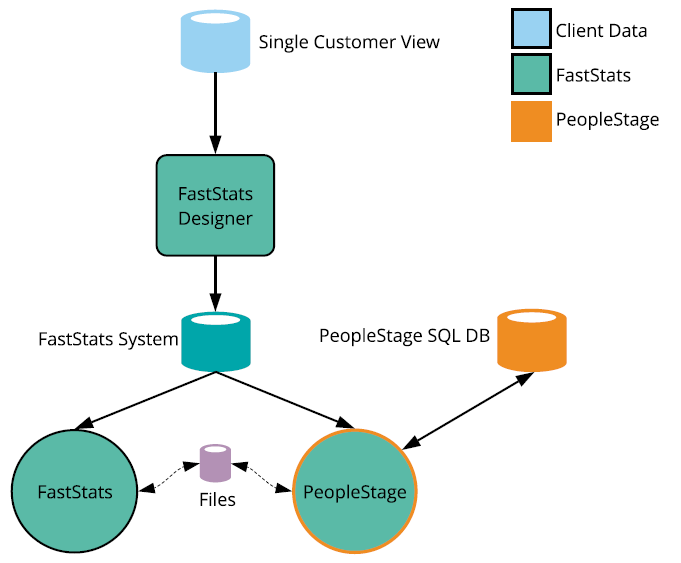
The diagram above shows how PeopleStage has access to both the SQL database and the FastStats system. FastStats Designer typically runs overnight to load the PeopleStage history into your FastStats system.
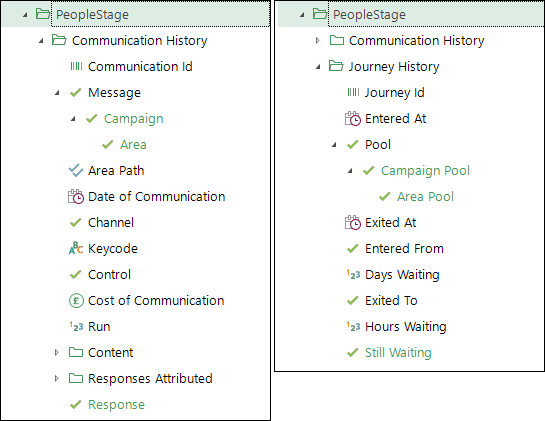
There is a standard design which an administrator can use to give you a standard set of variables. The history is divided into the Communications that people have received and the Journeys that they have taken as they move through the Pools in a Campaign.
The results in PeopleStage are typically available immediately, with some exceptions. The results in FastStats generally lag behind and are only available after the system has been rebuilt.
See Summary of data available in PeopleStage reports.
Communication history
The Communication History can be used to perform more detailed analysis of historic marketing in terms of who has received which communications. For example, to answer questions such as:
- Who has ever received the Welcome Campaign?
- How many communications are customers receiving per day/week etc.?
- Who has received multiple similar campaigns, such as our Africa Holiday Campaign?
Who has received multiple campaigns?
You can use the Communication History to first see who has received multiple Campaigns from an Area.
-
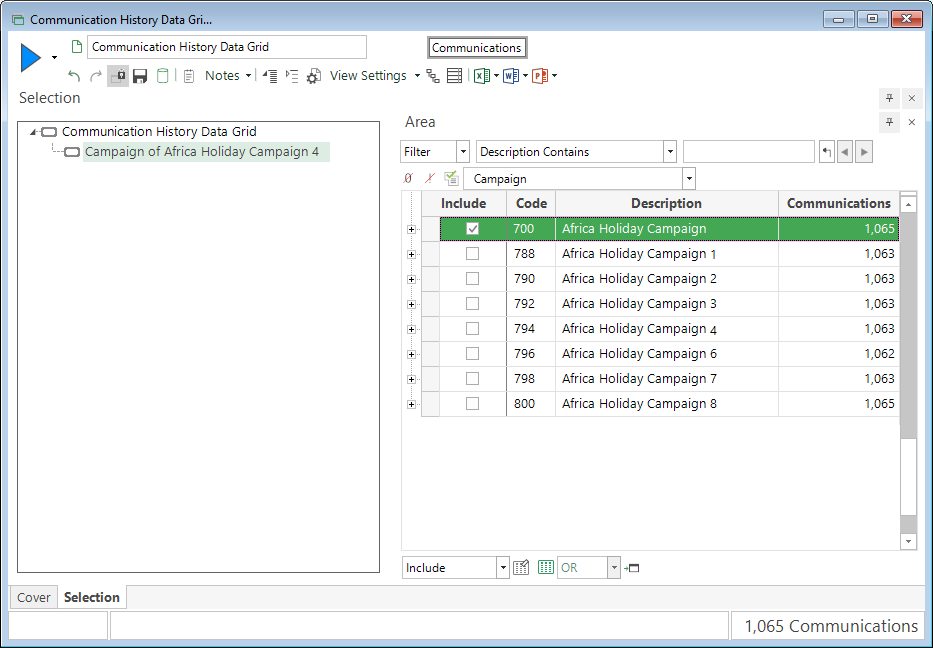
Create a selection at Communication level using the Area variable, selecting your Campaign
-
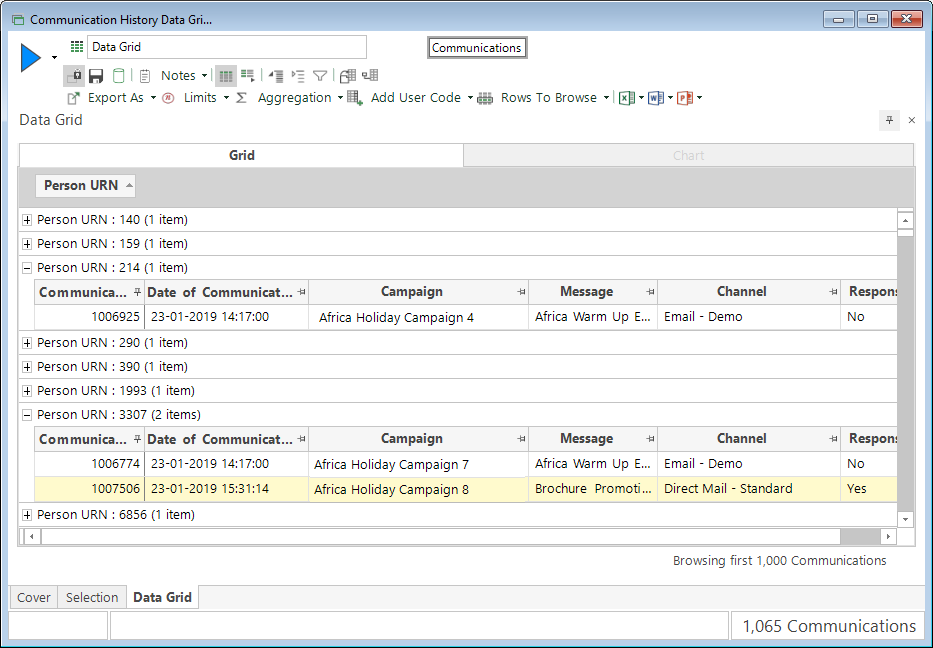
Add a Data Grid with the following variables: Date of Communication, Campaign, Message, Channel and Response
- Add the Person URN at the top of the Data Grid to group all the communications received by the same person and rebuild the Data Grid
- Update the selection to select the whole Area and rebuild the Data Grid
Journey history
The Journey History can be used to answer detailed questions about how people have journeyed through the Campaigns. For example:
- Who is currently awaiting their brochure?
- How long do people typically wait in a pool (e.g. in the Received Brochure pool before responding)?
- Who has got stuck in a particular Campaign (e.g. in the Holding Pool)?
- Who is currently in multiple Campaigns?
How did people move through the campaign?
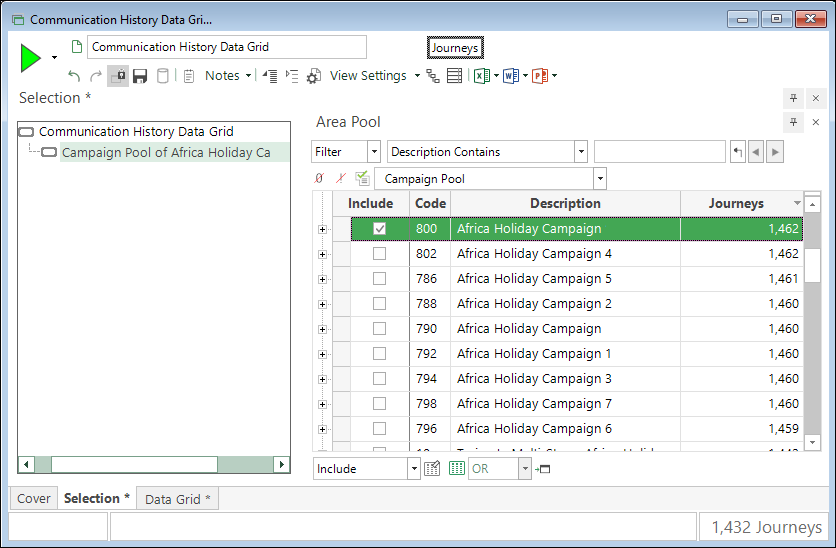
- Create a selection at the Journeys level using the Area Pool variable and then selecting a Campaign
-
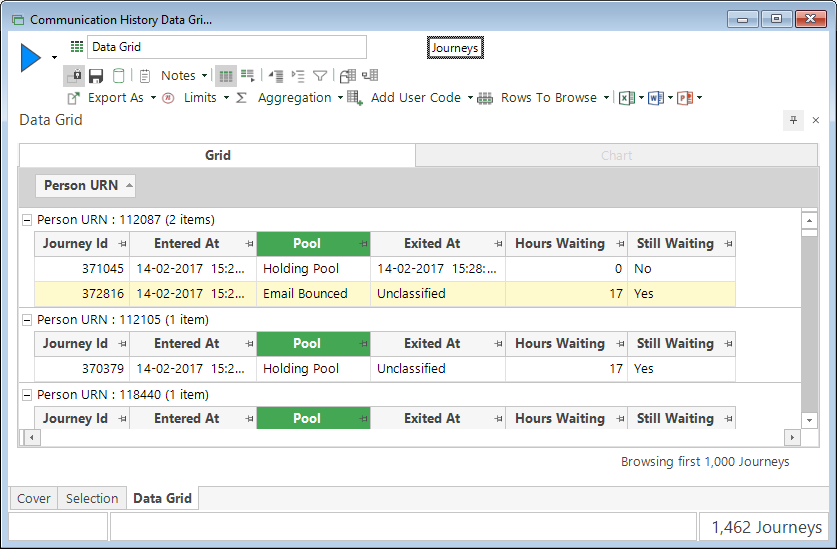
Add a Data Grid with the following variables: Entered At, Pool, Exited At, Hours Waiting and Still Waiting
-
Add the Person Urn at the top of the Data Grid to group all the communications received by the same person
- Click the Build button
Note
Most people only have one section to their journey as they enter the holding pool. Some people have multiple sections as they subsequently move on to their Await Brochure pool and beyond.
Opening reports in FastStats
In addition to looking at reports purely in PeopleStage, or doing analysis purely in FastStats, there is also a hybrid approach which allows you to save reports from PeopleStage and open them in FastStats. This provides an easy way to do some simple further analysis:
- Open a Campaign and go to a Message step
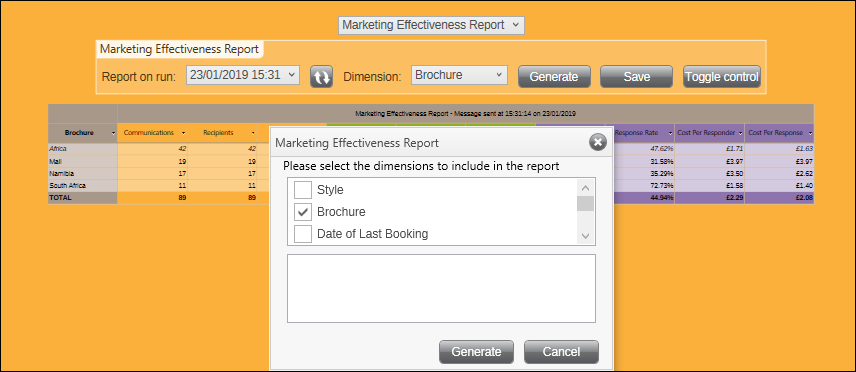
- Display the Marketing Effectiveness report for a recent run, report by the message content type from the drop-down menu, for example Brochure
- Click Save and then Generate to create a cube with the same layout as the PeopleStage report
- Enter a filename and save to your private folder
- Switch to FastStats and open the file from your private folder
- Click on the Cube tab and then the Build button
This provides an easy way to create a FastStats result with a complex layout and access to live results.
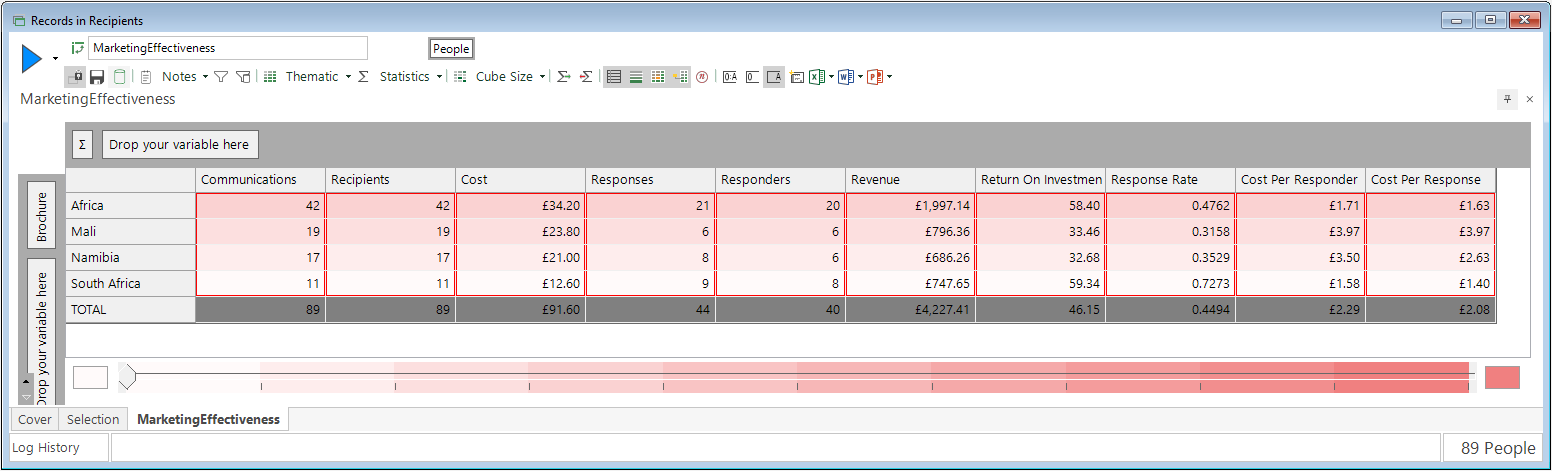
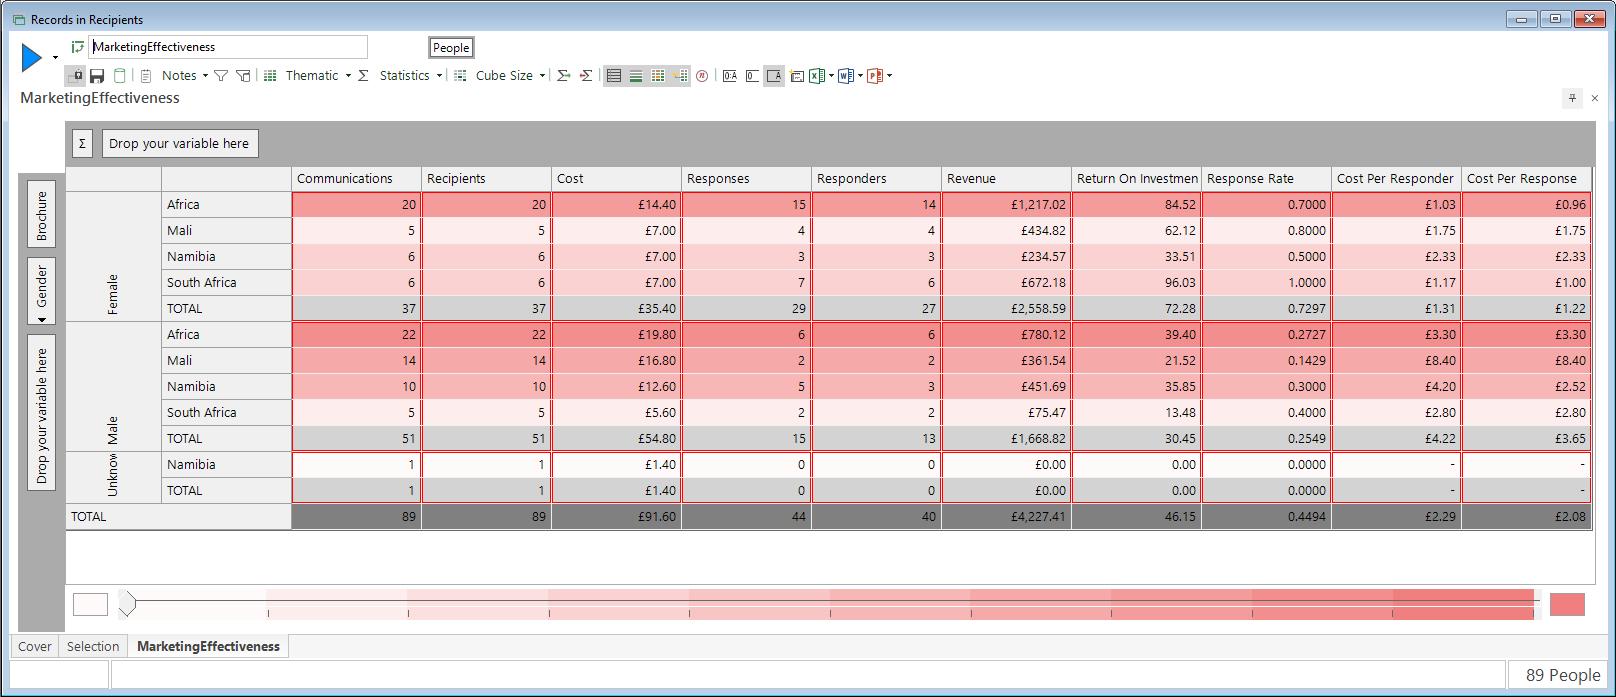
You could do further analysis, by for example adding Gender as a second dimension to see if male/female more likely to respond.
- Drag the Gender variable on to the drop zone below Brochure
- Click the Build button
Tip
You could also transfer this result to FastStats Excelsior or upload to Apteco Orbit.